ROI & Delivery Economics
The Economics of Staff Augmentation: True Cost vs. Value Delivered
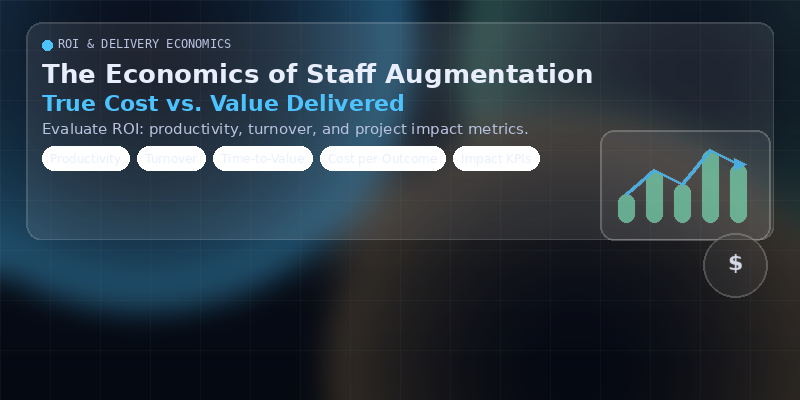
How to evaluate ROI using the metrics that matter — productivity, turnover risk, and project impact (not just bill rate comparisons).
Read time: ~8 min
Staff augmentation is often evaluated with a single question: “What’s the hourly rate?” That’s like judging a car by the price of the tires. Rate matters — but it’s not the economics.
The true economics of staff augmentation live in time-to-value, delivery throughput, quality, and retention. When these improve, the “expensive contractor” becomes cheap. When they don’t, even a low rate becomes an expensive distraction.
Why Rate Comparisons Mislead
Two people with the same title can produce wildly different value. “Cheap” talent often comes with hidden costs:
- slow ramp-up and dependency on others to unblock work
- rework due to poor standards, weak testing, or unclear requirements
- coordination overhead (more meetings, more reviews, more fixes)
- knowledge loss when a short-term resource rotates out
- risk exposure when governance and access controls are weak
The Real Cost Model: Total Cost of Delivery (TCD)
A practical way to evaluate staff augmentation is to calculate Total Cost of Delivery:
Hard costs
- bill rate / salary
- tools, licenses, environments
- management oversight
- recruiting cost (if FTE)
Hidden costs
- ramp time + onboarding friction
- rework and defect remediation
- delivery delays (opportunity cost)
- turnover and knowledge resets
- audit/security exposure
How to Measure Value Delivered (Not Activity)
The most reliable ROI evaluations combine delivery metrics with business impact metrics. Start with these categories:
1) Productivity and throughput
- cycle time: how long work takes from “in progress” to “done”
- throughput: completed stories/features per sprint
- lead time to release: time from request to production
- deployment frequency: how often you ship safely
2) Quality and stability
- defect rate and regression trends
- change failure rate (how often releases break something)
- MTTR (mean time to recover) and incident volume
- test coverage and automated gate adoption
3) Turnover risk and continuity
Turnover is a hidden tax on every roadmap. You can measure it indirectly:
- bus factor: how many people must stay for systems to remain maintainable
- documentation/runbook completeness as part of “done”
- handoff readiness before a role rolls off
- onboarding time for replacement resources
4) Business impact metrics
- revenue enablement (features shipped that unlock sales or retention)
- cost reduction (automation, cloud optimization, reduced manual labor)
- risk reduction (security fixes, compliance readiness, fewer audit findings)
- time saved for internal teams (unblocked programs, reduced coordination load)
A Simple ROI Scorecard for Staff Augmentation
Use a lightweight scorecard to compare options consistently:
- Time-to-value: how quickly can this person/team deliver useful output?
- Outcome clarity: are 30/60/90-day deliverables defined?
- Integration cost: how much internal effort is required to onboard and manage?
- Quality signals: what gates, testing, and review discipline are standard?
- Continuity: what knowledge transfer artifacts are produced as the work ships?
- Impact: which business KPIs move, and by how much?
How AptoTek Approaches Staff Augmentation Economics
AptoTek’s model is designed to optimize value delivered:
- Outcome-first staffing: roles mapped to measurable 30/60/90-day deliverables
- Integration into your delivery system: same backlog, standards, and quality gates
- Governance and auditability: access controls, change traceability, evidence-by-design
- Durable outcomes: documentation and handoffs embedded into “done”
Bottom Line
The economics of staff augmentation aren’t about picking the lowest rate. They’re about maximizing time-to-value and minimizing delivery friction. Measure what matters, and the ROI becomes obvious.